Watch the video
Player by YouTube. Open original video ↗
Average retail petrol prices increased slightly while diesel prices decreased slightly in the ACCC's weekly monitoring update published on 16 October. The report covers capital cities and regional locations as the regulator tracks fuel markets following disruption in the Middle East.
Its scope includes crude oil, refined-fuel benchmarks, domestic wholesale prices and retail prices. Those are different stages in the supply chain. A change in one does not establish the exact price a driver will see at a particular service station that afternoon.
An average can hide a useful local comparison
For a motorist, the relevant comparison is the same fuel grade at nearby locations and a current timestamp. A cheaper advertised grade or an old price does not make a valid comparison. The extra distance and fuel used to reach a cheaper station also affect the saving.

The ACCC separately explains price cycles in several large cities. Those retail patterns should not be assumed to apply identically to every regional town or every fuel. A weekly national account and a local price cycle answer different questions.
Do the arithmetic on the actual purchase
For illustration, a ten-cent-per-litre difference on a 40-litre purchase is four dollars. That is simple purchase arithmetic, not a claim about a current market price. It can help a household decide whether a detour is worthwhile without chasing a headline percentage.
Businesses budgeting for vehicles should also separate expected litres from the assumed price per litre. If both change, a larger fuel bill cannot be explained by the price alone. Keep the assumptions visible when comparing a forecast with an invoice.
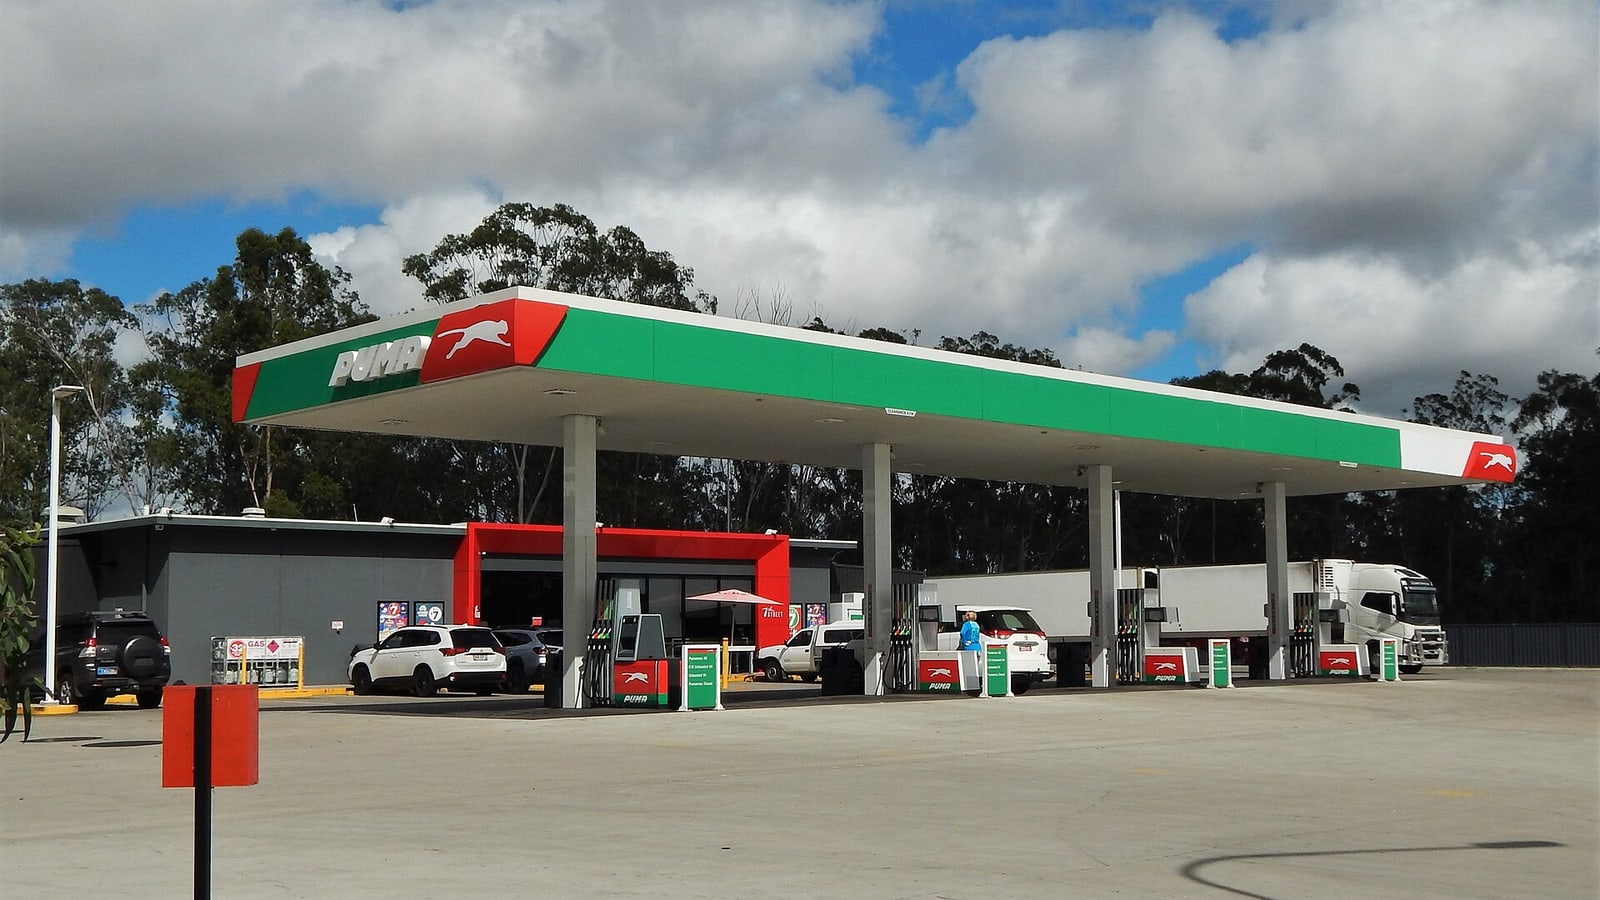
The latest update is evidence of recent market movement, not a promise that prices will continue in the same direction. Before publication or a purchase decision, check the next dated report and current local prices. The money and calculator images are illustrations, not a chart of today's fuel market.
Related video: Reserve Bank of Australia. The RBA’s monetary-policy explainer provides broader inflation context. It is not a fuel-price forecast or the ACCC’s weekly briefing. Watch Monetary Policy Transmission – Economic Activity Employment and Inflation.

About the author
RullikClear, sourced explainers on Australia and the world
Rullik is the pen name of the founder of Australia Illuminate (Auslume). Rullik writes plain-language explainers on life in Australia, from immigration, study and work to money, sport and screen culture, always linking to the official sources behind each story. Every story is reviewed before publication.
More from Rullik ↗Image credits
- A calculator and a pen resting on a sheet of paper: Photo: Aaron Lefler on Unsplash (Unsplash License), https://unsplash.com/photos/a-calculator-and-a-pen-sitting-on-top-of-a-piece-of-paper-Vs6ip7fsld8