Watch the video
Player by YouTube. Open original video ↗
The World Meteorological Organization's latest State of Global Water Resources report describes continuing pressure on freshwater reserves and marked differences in river conditions. Released on 17 September 2026, it assesses 2025 alongside trends over several years.
WMO reports a persistent decline in total water stored on and beneath land since the middle of the previous decade. It also highlights continued glacier loss. These are measures of a wider water system, not simply a count of rainy days.
Rainfall and stored water answer different questions
A wet month can increase river flow without restoring a depleted aquifer. Water in soil, rivers, reservoirs, groundwater, snow and ice moves through different parts of the system at different speeds. Combining them into one casual claim that a place has enough water can hide important changes.

For readers with family in mountain regions, glacier change is particularly relevant as a long-term water issue. It should not be converted into a prediction that a specific village will lose its water supply on a particular date. That requires local evidence and a much more detailed assessment.
Compare like with like
When reading a map, check the measured variable, reference period and location. A map of river discharge cannot be read as if it directly shows drinking-water quality or the amount in a household tank. A national average also cannot describe every catchment.
The report combines observations and modelling. Its value includes bringing those sources together, while its methods and coverage still matter when interpreting a particular finding. More precise local information may be needed for infrastructure or farming decisions.
The useful message is to look beyond whether recent weather felt wet or dry. A community's resilience depends partly on reserves and the systems that manage them over time. For current restrictions, water quality or emergency instructions, residents should use their local authority's latest advice. This report provides the larger context, not a substitute for it.
Related video: World Meteorological Organization - WMO. This WMO video accompanied the previous report in September 2025. Use the new 2026 release for findings about 2025. Watch The State of Global Water Resources report - English.

About the author
RullikClear, sourced explainers on Australia and the world
Rullik is the pen name of the founder of Australia Illuminate (Auslume). Rullik writes plain-language explainers on life in Australia, from immigration, study and work to money, sport and screen culture, always linking to the official sources behind each story. Every story is reviewed before publication.
More from Rullik ↗This article was prepared with AI assistance.
Image credits
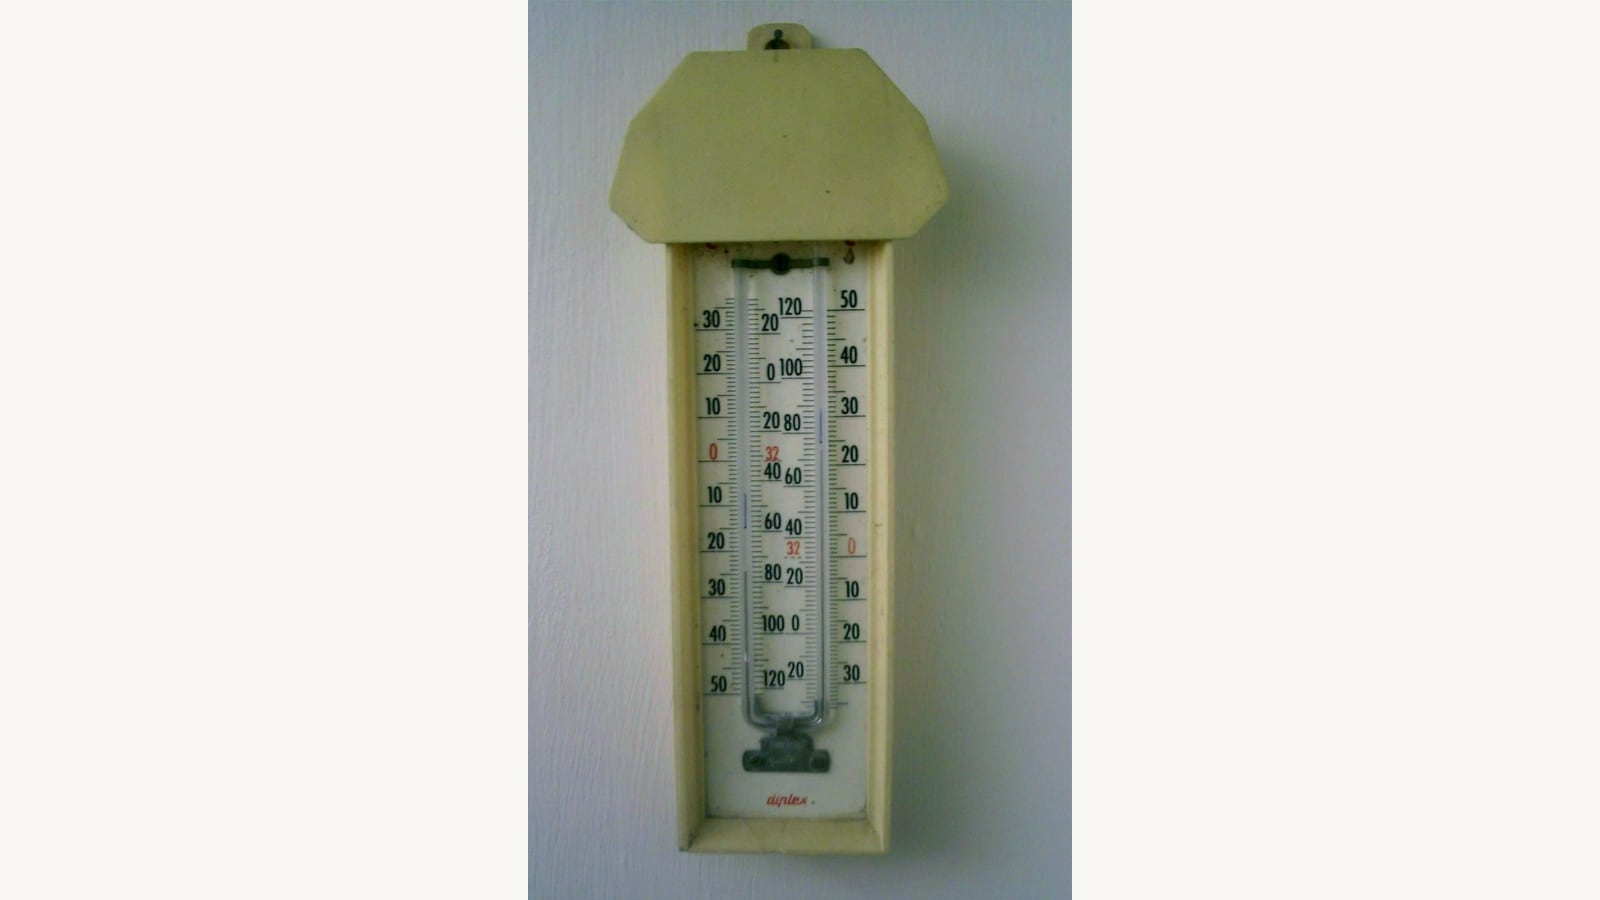
- A maximum and minimum thermometer mounted on a wall. Illustrative photograph, not a current Australian temperature reading.: Photo: Lumos3 at English Wikipedia / Wikimedia Commons, CC BY-SA 3.0 (https://creativecommons.org/licenses/by-sa/3.0/). Resized without cropping. Source: https://commons.wikimedia.org/wiki/File:Max_Min_Thermometer.JPG